Your fasting glucose is "normal." Your doctor says you're fine. But you're gaining weight around your midsection. You're tired after meals. You crave sugar constantly. You feel like your metabolism has stopped working.
Here's what your doctor didn't tell you: insulin resistance can be silently progressing for 10–15 years before your glucose ever shows a problem.
By the time your fasting glucose is elevated, you're already deep into metabolic dysfunction. The good news? Insulin resistance is detectable early—and it's reversible.
What Is Insulin Resistance?
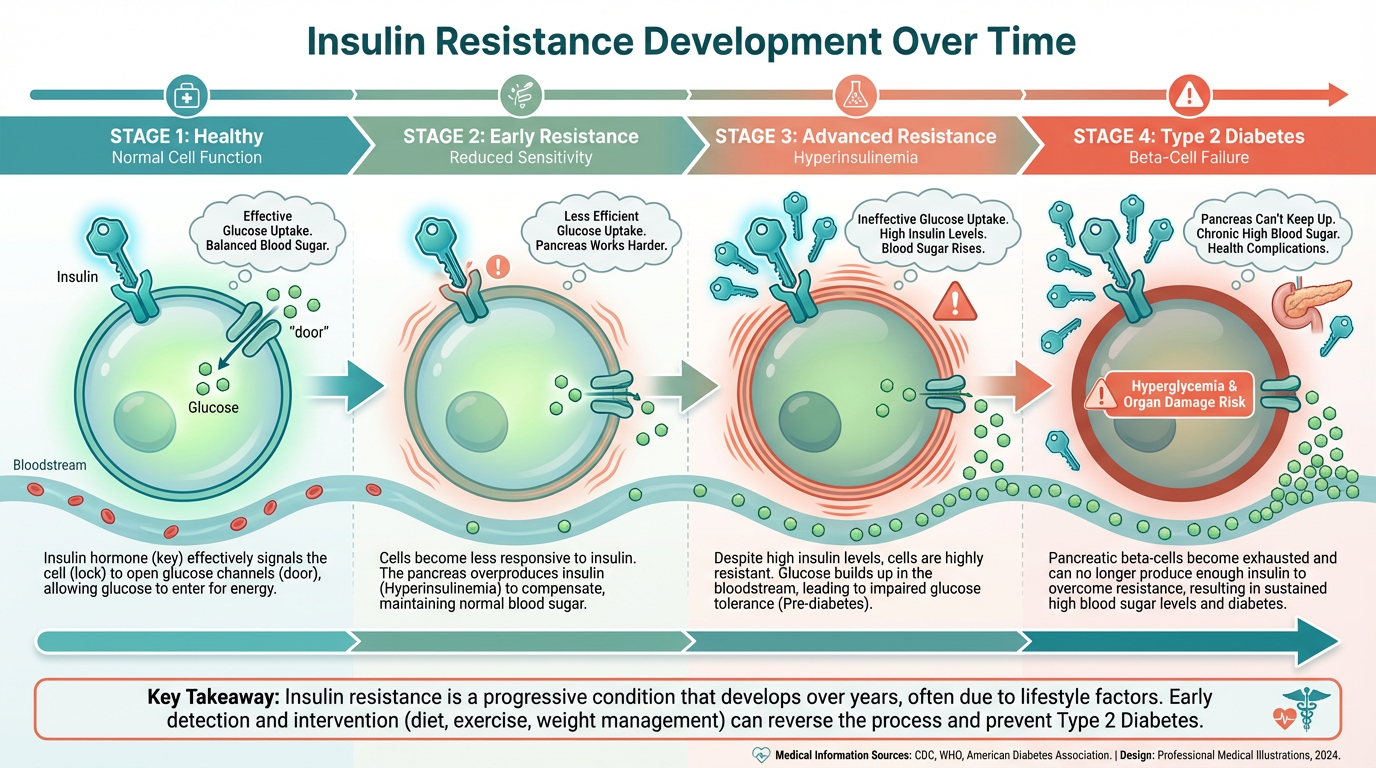
Insulin is a hormone produced by your pancreas. Its job is to move glucose (sugar) from your bloodstream into your cells to be used for energy.
Insulin resistance means your cells stop responding to insulin's signal. To compensate, your pancreas produces more and more insulin to force glucose into cells. For years, your body can keep blood sugar normal—but only by cranking out higher and higher levels of insulin.
This is called hyperinsulinemia—and it's the earliest detectable sign of metabolic dysfunction.
The Insulin Resistance Progression
Stage 1: Normal metabolism
Stage 2: Insulin resistance begins (functional testing detects it here)
Stage 3: Hyperinsulinemia (high insulin, normal glucose)
Stage 4: Impaired fasting glucose (standard testing catches it here)
Stage 5: Prediabetes
Stage 6: Type 2 diabetes
Standard testing only catches you at stage 4 or 5. Functional testing catches you at stage 2.
Why Standard Testing Misses Insulin Resistance
Most doctors only check fasting glucose. If it's under 100 mg/dL, you're told you're fine. But fasting glucose is a lagging indicator—it doesn't rise until your pancreas can no longer produce enough insulin to compensate.
What Standard Testing Misses:
- Fasting insulin - This is the earliest marker. It can be elevated for years while glucose stays normal.
- HOMA-IR (Homeostatic Model Assessment of Insulin Resistance) - A calculation using fasting glucose and fasting insulin that quantifies insulin resistance
- HbA1c trends - Even slight increases within "normal" range (5.4% → 5.7%) signal worsening insulin sensitivity
- Post-meal glucose spikes - How high your blood sugar goes after eating reveals insulin function in real-time
Critical Insight: By the time fasting glucose is elevated, you've already lost years of opportunity to reverse the dysfunction.
Symptoms of Insulin Resistance
Insulin resistance doesn't show up as one clear symptom—it's a pattern:
- Weight gain (especially around the belly) - Insulin is a fat-storage hormone; high insulin = fat accumulation
- Difficulty losing weight - Even with diet and exercise, weight won't budge
- Fatigue after meals - Blood sugar spikes and crashes leave you exhausted
- Intense sugar cravings - Your cells are starving for glucose even though your blood is full of it
- Brain fog - Your brain isn't getting stable energy
- High blood pressure - Insulin resistance damages blood vessels
- Skin tags or dark patches on skin (acanthosis nigricans) - Physical signs of insulin resistance
- PCOS in women - Polycystic ovary syndrome is driven by insulin resistance
- Elevated triglycerides, low HDL - Classic lipid pattern of insulin resistance
If you recognize multiple symptoms on this list, testing for insulin resistance is critical.
How to Test for Insulin Resistance
These are the tests we run to catch insulin resistance early:
1. Fasting Insulin
The single best early marker.
| Fasting Insulin Level | Status |
|---|---|
| <5 µIU/mL | Optimal |
| 5–8 µIU/mL | Normal (watch for trends) |
| 8–10 µIU/mL | Early insulin resistance starting |
| >10 µIU/mL | Insulin resistance present |
| >25 µIU/mL | Significant insulin resistance |
2. Fasting Glucose
Should be checked alongside insulin.
| Fasting Glucose | Status |
|---|---|
| 70–85 mg/dL | Optimal |
| 86–99 mg/dL | Normal (but trending up) |
| 100–125 mg/dL | Prediabetes |
| ≥126 mg/dL | Diabetes |
3. HOMA-IR (Calculated)
Calculated from fasting glucose and fasting insulin.
HOMA-IR Formula:
(Fasting Insulin in µIU/mL × Fasting Glucose in mg/dL) ÷ 405
| HOMA-IR Score | Status |
|---|---|
| <1.0 | Optimal insulin sensitivity |
| 1.0–1.9 | Early insulin resistance |
| >2.0 | Significant insulin resistance |
4. HbA1c (Hemoglobin A1c)
Reflects average blood sugar over the past 3 months.
| HbA1c Level | Status |
|---|---|
| <5.3% | Optimal |
| 5.3–5.6% | Normal |
| 5.7–6.4% | Prediabetes |
| ≥6.5% | Diabetes |
5. Lipid Panel
Insulin resistance has a signature lipid pattern:
- High triglycerides (>150 mg/dL)
- Low HDL (<40 mg/dL in men, <50 mg/dL in women)
- High triglyceride-to-HDL ratio (>3:1 signals insulin resistance)
6. Continuous Glucose Monitor (CGM) - Optional but Powerful
Wear a sensor for 10–14 days to see your glucose in real-time:
- How high does your glucose spike after meals?
- How long does it take to return to baseline?
- Do you have overnight glucose spikes?
A CGM reveals patterns no single blood test can show.
What Causes Insulin Resistance?
Insulin resistance doesn't happen overnight. It's the result of chronic metabolic stress from multiple factors:
1. Diet (The Primary Driver)
- Refined carbohydrates - Bread, pasta, pastries, sugary drinks spike insulin repeatedly
- Fructose overload - High-fructose corn syrup, fruit juice, excess fruit → fat accumulation in the liver → insulin resistance
- Frequent eating - Constant snacking keeps insulin elevated all day
- Low protein, low fiber - Blood sugar spikes higher without these stabilizers
2. Sedentary Lifestyle
Muscle is your body's largest glucose sink. When you don't use your muscles, glucose has nowhere to go → insulin resistance develops.
3. Chronic Stress
Cortisol raises blood sugar. Chronic stress = chronic high cortisol = chronic high insulin = insulin resistance.
4. Poor Sleep
Just one night of poor sleep reduces insulin sensitivity by up to 30%. Chronic sleep deprivation is a major insulin resistance driver.
5. Inflammation
Chronic inflammation (from gut dysfunction, poor diet, toxins) disrupts insulin signaling at the cellular level.
6. Fatty Liver (NAFLD)
Non-alcoholic fatty liver disease is both a cause and consequence of insulin resistance. Fat accumulation in the liver impairs its ability to regulate glucose.
How to Reverse Insulin Resistance
Insulin resistance is not a life sentence. With the right interventions, you can restore insulin sensitivity in 3–6 months.
1. Nutrition: The Foundation
Prioritize Protein and Fat First
- Start every meal with protein (30–40g per meal)
- Add healthy fats (olive oil, avocado, nuts, fatty fish)
- Then add non-starchy vegetables
- Carbs last (and only if you've earned them with movement)
Eliminate or Drastically Reduce:
- Refined sugars and carbohydrates
- Processed foods
- Seed oils (soybean, corn, canola)
- Fruit juice and sugary drinks
Carb Timing Strategy:
- Eat carbs post-workout when insulin sensitivity is highest
- Avoid carbs at breakfast (keeps insulin low all morning)
- Consider carb cycling (lower carbs most days, higher on training days)
2. Intermittent Fasting (IF)
Fasting lowers insulin and improves insulin sensitivity. Start with a 12-hour overnight fast, then progress to 14–16 hours if tolerated.
Example: Finish dinner by 7 PM, don't eat until 11 AM the next day (16:8 protocol).
3. Resistance Training
Muscle is metabolically active tissue that soaks up glucose. Building muscle improves insulin sensitivity dramatically.
- Lift weights 3–4× per week
- Focus on compound movements (squats, deadlifts, presses)
- Progressive overload (gradually increase weight)
4. Strategic Cardio
Post-meal walks are incredibly effective:
- 10–15 minute walk after meals lowers post-meal glucose spikes by 20–30%
- Zone 2 cardio (easy, conversational pace) 3–5× per week improves mitochondrial function
5. Sleep Optimization
- 7–9 hours of quality sleep nightly
- Consistent sleep/wake times
- Dark, cool room
- No screens 1–2 hours before bed
6. Stress Management
- Lower cortisol = lower fasting insulin
- Daily stress practices: breathwork, meditation, nature time
- Don't overtrain (exercise is a stressor too)
7. Targeted Supplementation
Note: Supplement recommendations are based on peer-reviewed research. Always consult with a healthcare provider before starting any supplement protocol.
- Berberine - 500 mg 3× daily (as effective as metformin in studies[1])
- Chromium - 200–400 mcg daily (improves insulin signaling[2])
- Alpha-lipoic acid - 600 mg daily (improves glucose uptake[3])
- Magnesium - 400–600 mg daily (insulin co-factor[4])
- Omega-3 fatty acids - 2–3g EPA/DHA daily (reduces inflammation[5])
- Vitamin D - Optimize to 50–80 ng/mL (improves insulin sensitivity[6])
Insulin Resistance Reversal Timeline
2–4 weeks: Fasting insulin starts dropping
6–8 weeks: Energy improves, cravings reduce, weight starts shifting
3 months: HOMA-IR significantly improved, body composition changing
6 months: Full insulin sensitivity restored in most cases (confirmed by retesting)
Why Early Detection Matters
The earlier you catch insulin resistance, the faster and easier it is to reverse. If you wait until you're prediabetic or diabetic, you've lost years of metabolic function—and reversal becomes much harder.
The Bottom Line: Test early. Intervene early. Reverse it before it's a disease.
References:
- Yin J, et al. Efficacy of berberine in patients with type 2 diabetes mellitus. Metabolism. 2008;57(5):712-7.
- Anderson RA. Chromium and insulin resistance. Nutr Res Rev. 2003;16(2):267-75.
- Golbidi S, et al. Diabetes and alpha lipoic acid. Front Pharmacol. 2011;2:69.
- Barbagallo M, Dominguez LJ. Magnesium and type 2 diabetes. World J Diabetes. 2015;6(10):1152-7.
- Calder PC. Omega-3 fatty acids and inflammatory processes. Nutrients. 2010;2(3):355-74.
- Pittas AG, et al. Vitamin D and diabetes. J Steroid Biochem Mol Biol. 2010;121(1-2):425-9.
Ready to Test and Reverse Insulin Resistance?
Let's run your fasting insulin, calculate your HOMA-IR, and build your personalized reversal protocol.
Schedule Your Free Discovery Call